By Nikki Johnson
Regional Economist
What makes the Hampton Roads economy unique? Every region has a mix of distinct industries that shape its regional economy. Location quotients (LQs) help us see which sectors truly specialize here, not just by head count but by how concentrated they are compared to the nation. A location quotient measures an industry’s employment concentration in a region relative to its concentration in the nation. An LQ of 1.0 in a particular industry means the region and nation are equally specialized, while an LQ above 1.0 means the region has a higher concentration of employment in that industry relative to the nation.
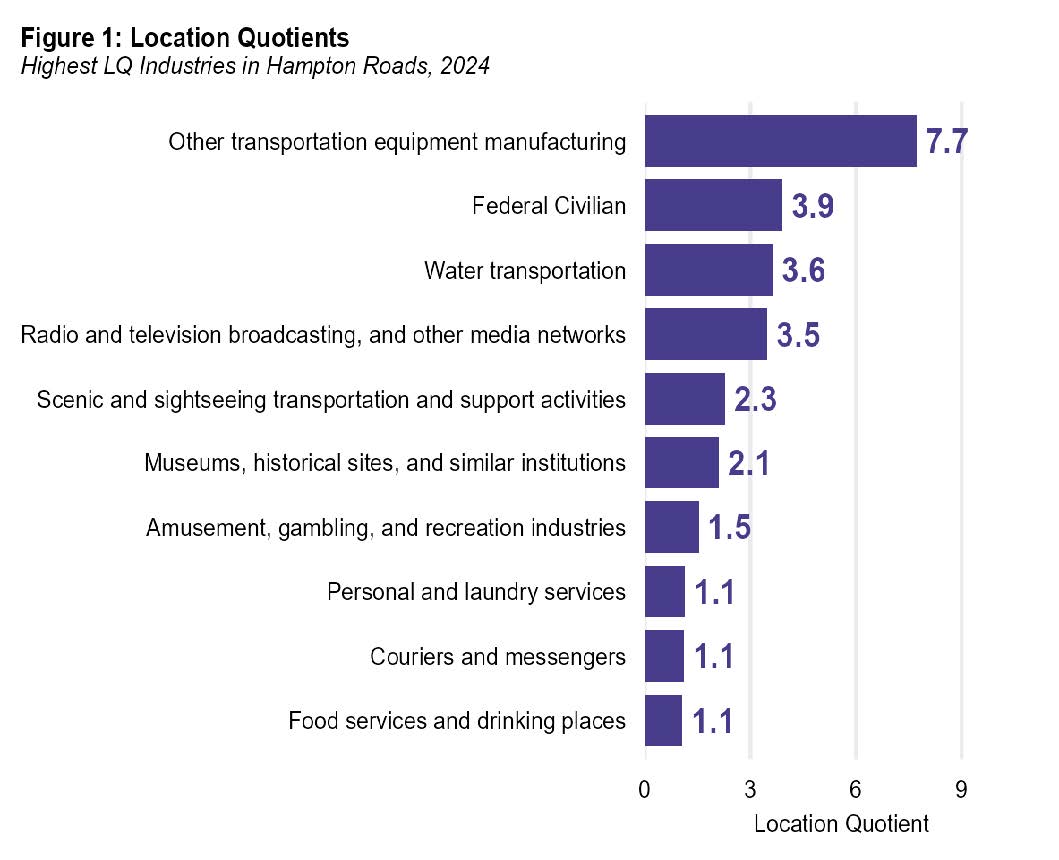
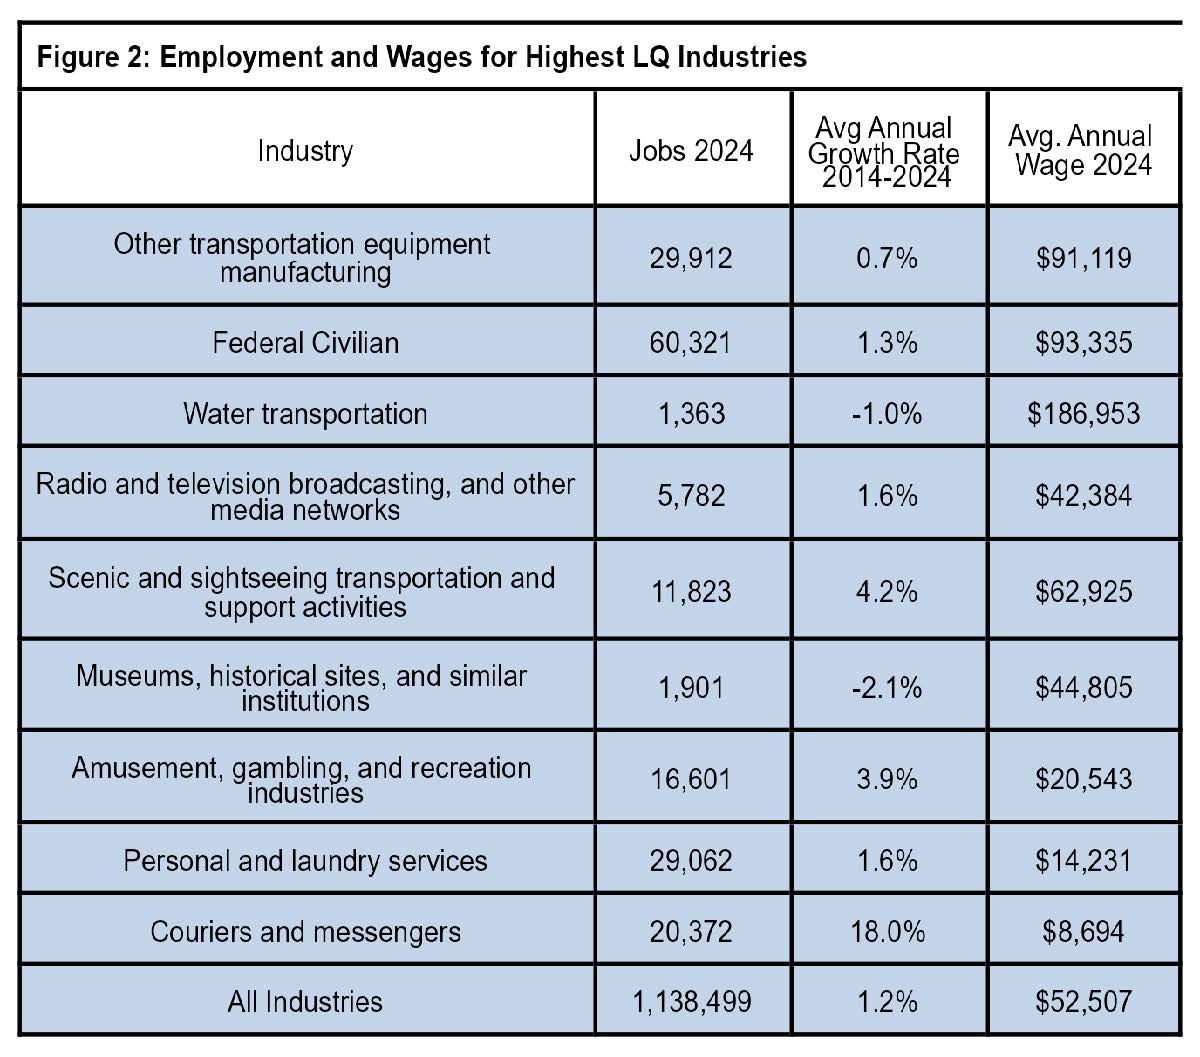
The Hampton Roads economy is often described as resting on three pillars: defense, the port, and tourism. Figure 1 shows how clearly that structure appears when we look at the industries with the highest location quotients. Employment in shipbuilding, captured in other transportation equipment manufacturing, stands far above every other sector, with a concentration of employment 7.7 times the national average, reflecting the scale of the region’s naval industrial base. Another defense related sector, federal civilian employment, follows with an LQ of 3.9, driven by the large number of military installations spread across the region. Water transportation posts an LQ of 3.6, highlighting the weight of port activity in the local economy. Several tourism related industries, including scenic transportation, amusement and recreation, and museums, also have LQs above one. The employment and wage data in Figure 2 add more detail to this picture. Other transportation equipment manufacturing represents 2.6% of all jobs in the region with an average annual pay 1.7 times the regional average. Federal civilian employment accounts for about 5.3% of total jobs, with average wages 1.8 times the regional average. Water transportation represents less than 1% of all jobs, though many port related workers such as analysts, administrative staff, and logistics employees are classified in other industries rather than in water transportation itself. Several tourism related industries show faster growth but lower wages. Scenic and sightseeing transportation wages are slightly above the regional average, and employment in this sector grew 4.2% per year between 2014 and 2024.
Source: REMI and HRPDC.
LQs do not tell us everything, but they reveal which industries anchor the region. Hampton Roads shows clear strengths in sectors tied to shipbuilding and other defense related sectors, the port, and tourism. When we understand which industries are truly concentrated here, we can make better decisions about long term planning. Knowing what makes the region different is the first step in preparing for what comes next.
Note: Several indicators featured in the rest of this report have not yet been updated because of the recent government shutdown.
More Information and Regional Indicators